Behavior Chart: What Works, What Backfires

A behavior chart is any visible system — a clip on a poster, a row of stickers, a points sheet — used to track and reward a student’s classroom behavior in real time. The format matters more than the label: a public, whole-class chart that displays every child’s status to the room has a documented track record of backfiring, while a private, individually-tracked version of the same idea has real evidence behind it. If you’ve been handed a chart, inherited one from a colleague, or are deciding whether to build one from scratch, the type you pick is the decision that determines whether it works.
That distinction gets lost because “behavior chart” covers several genuinely different tools. Below is what each type actually does, what the research says about each, and a framework for choosing — or fixing — the one in your classroom.
What Is a Behavior Chart, Exactly?
Four formats get called a behavior chart, and they behave very differently (for how each one is set up and run day to day, see behavior charts for classroom management):
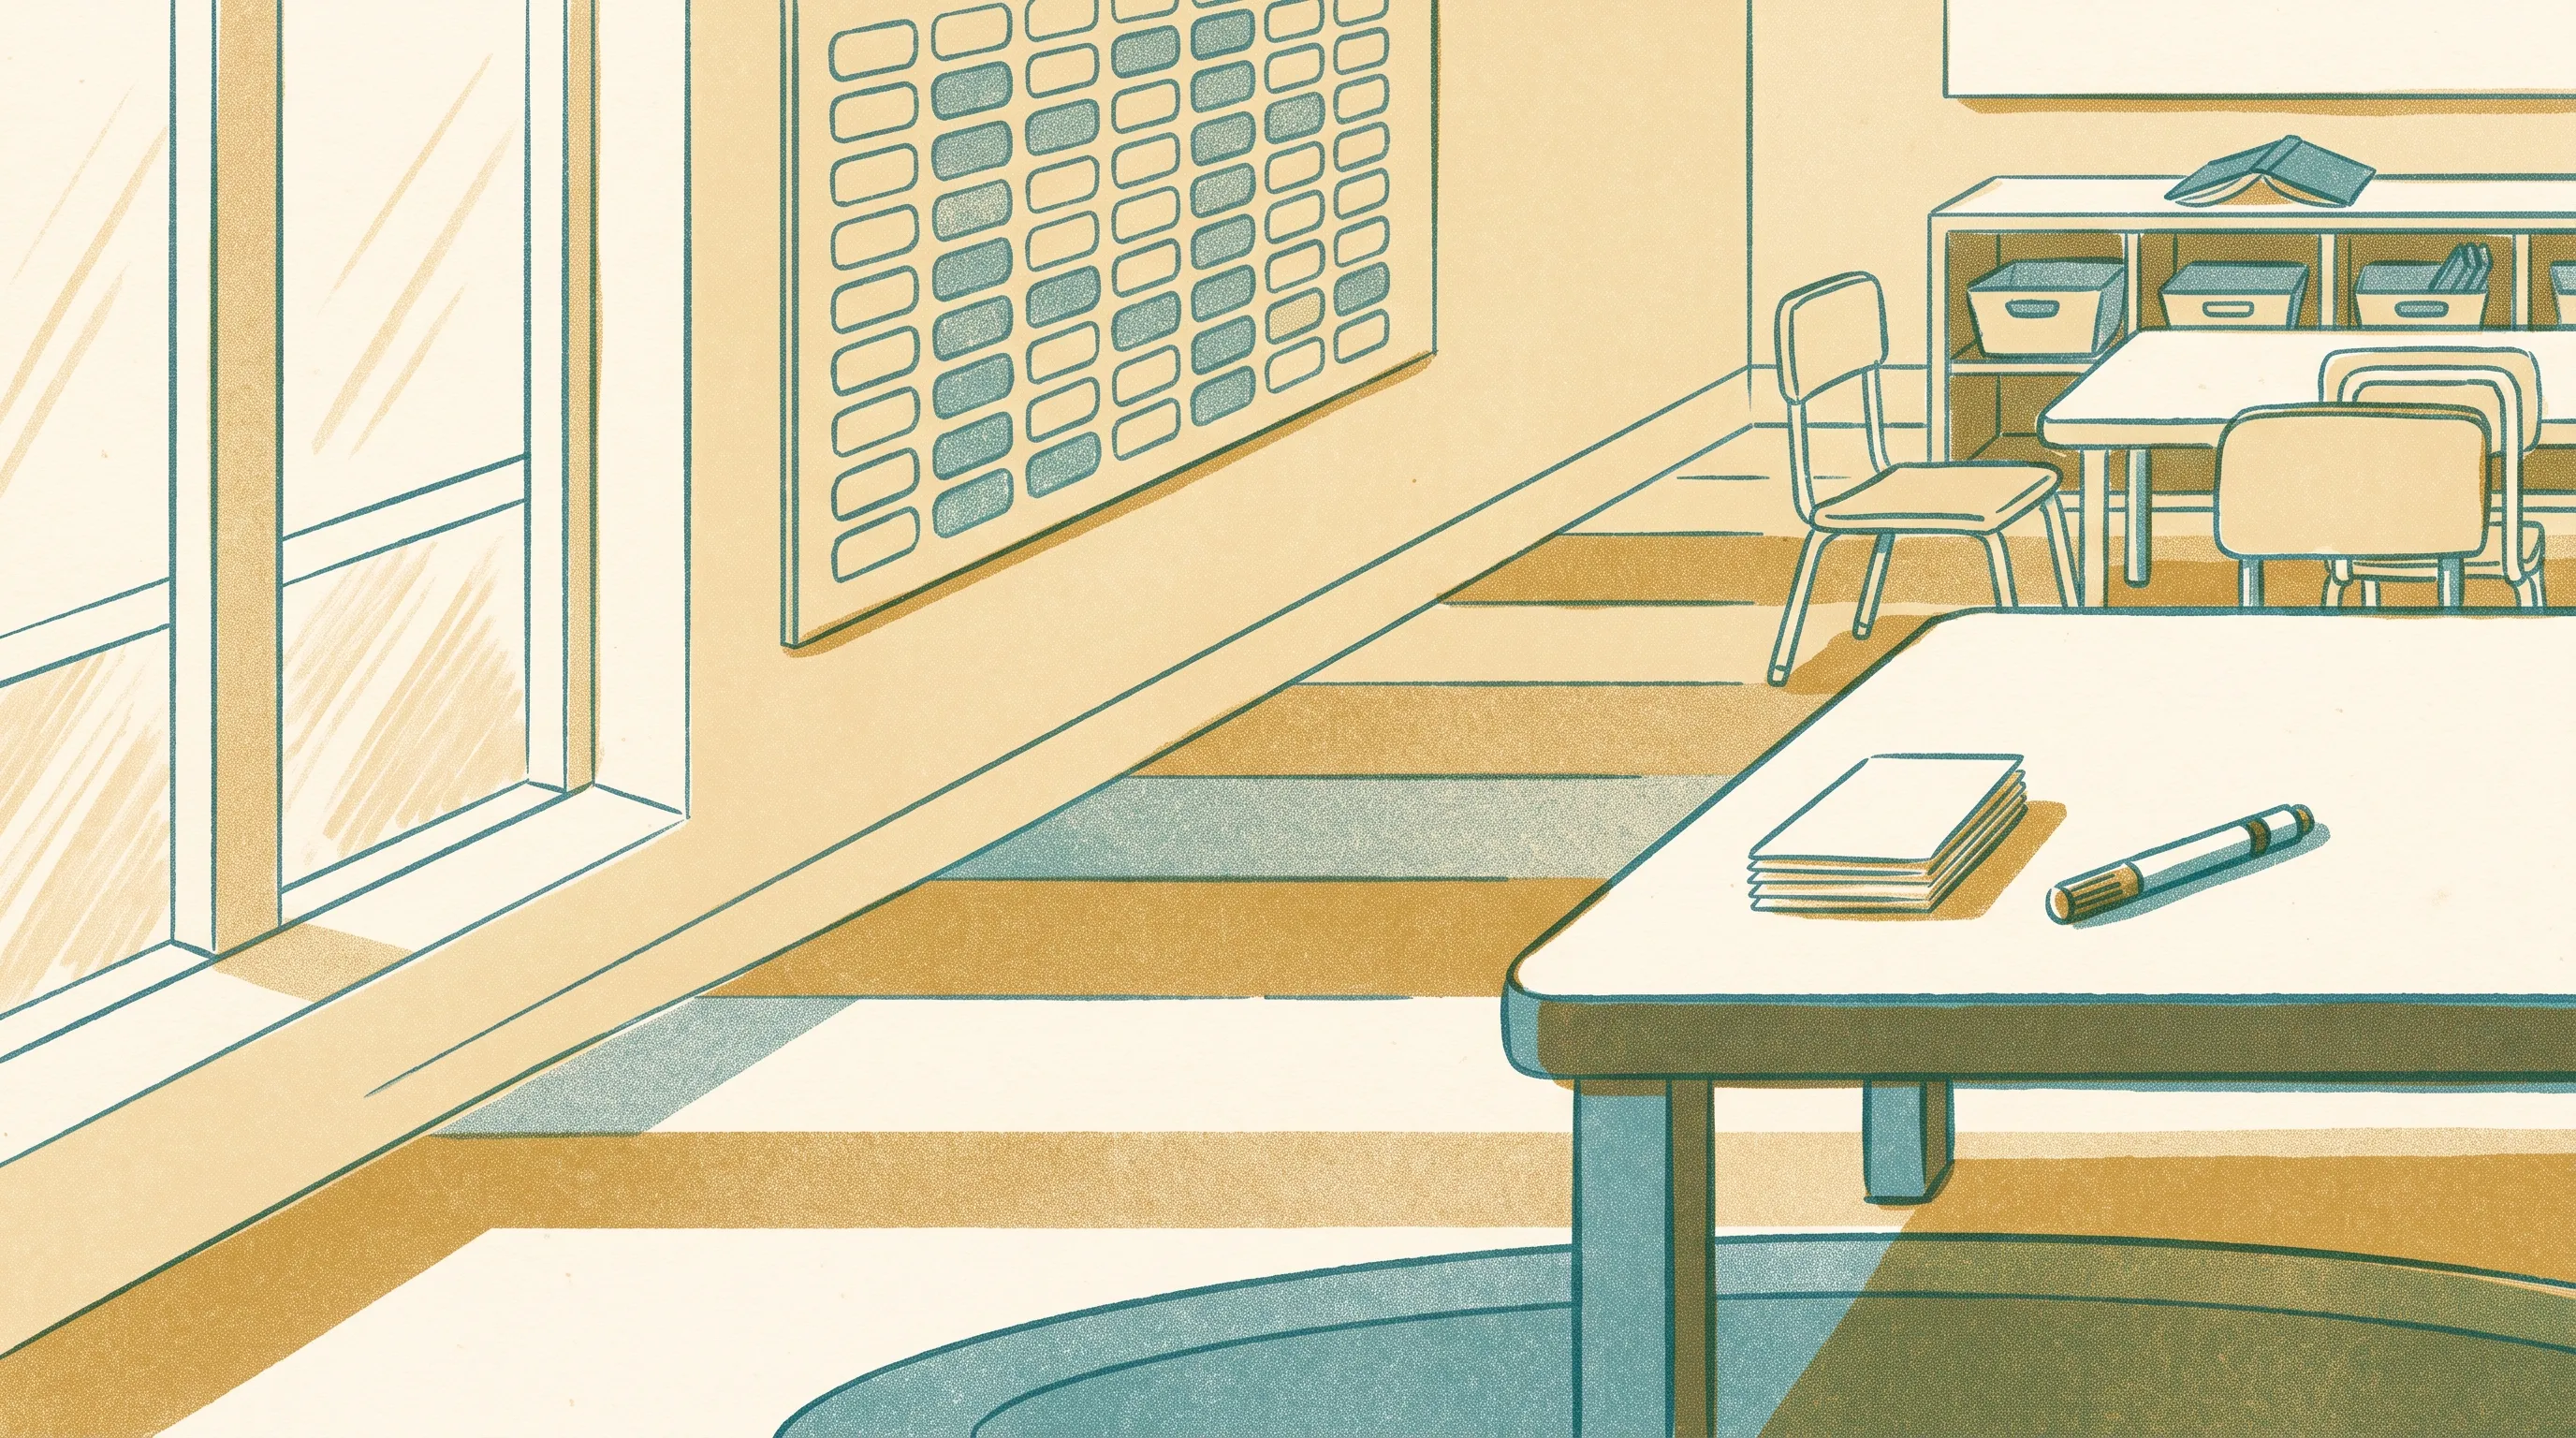
- The public clip or color chart. Every student’s clothespin or card sits on a poster, moving between zones (usually green, yellow, red) as the day goes on. Status is visible to the whole class at all times, and moves are often announced out loud.
- The individual, private chart. One student — often as part of a specific behavior plan — has a personal tracking sheet that only they, the teacher, and their family see. Nothing is displayed to peers.
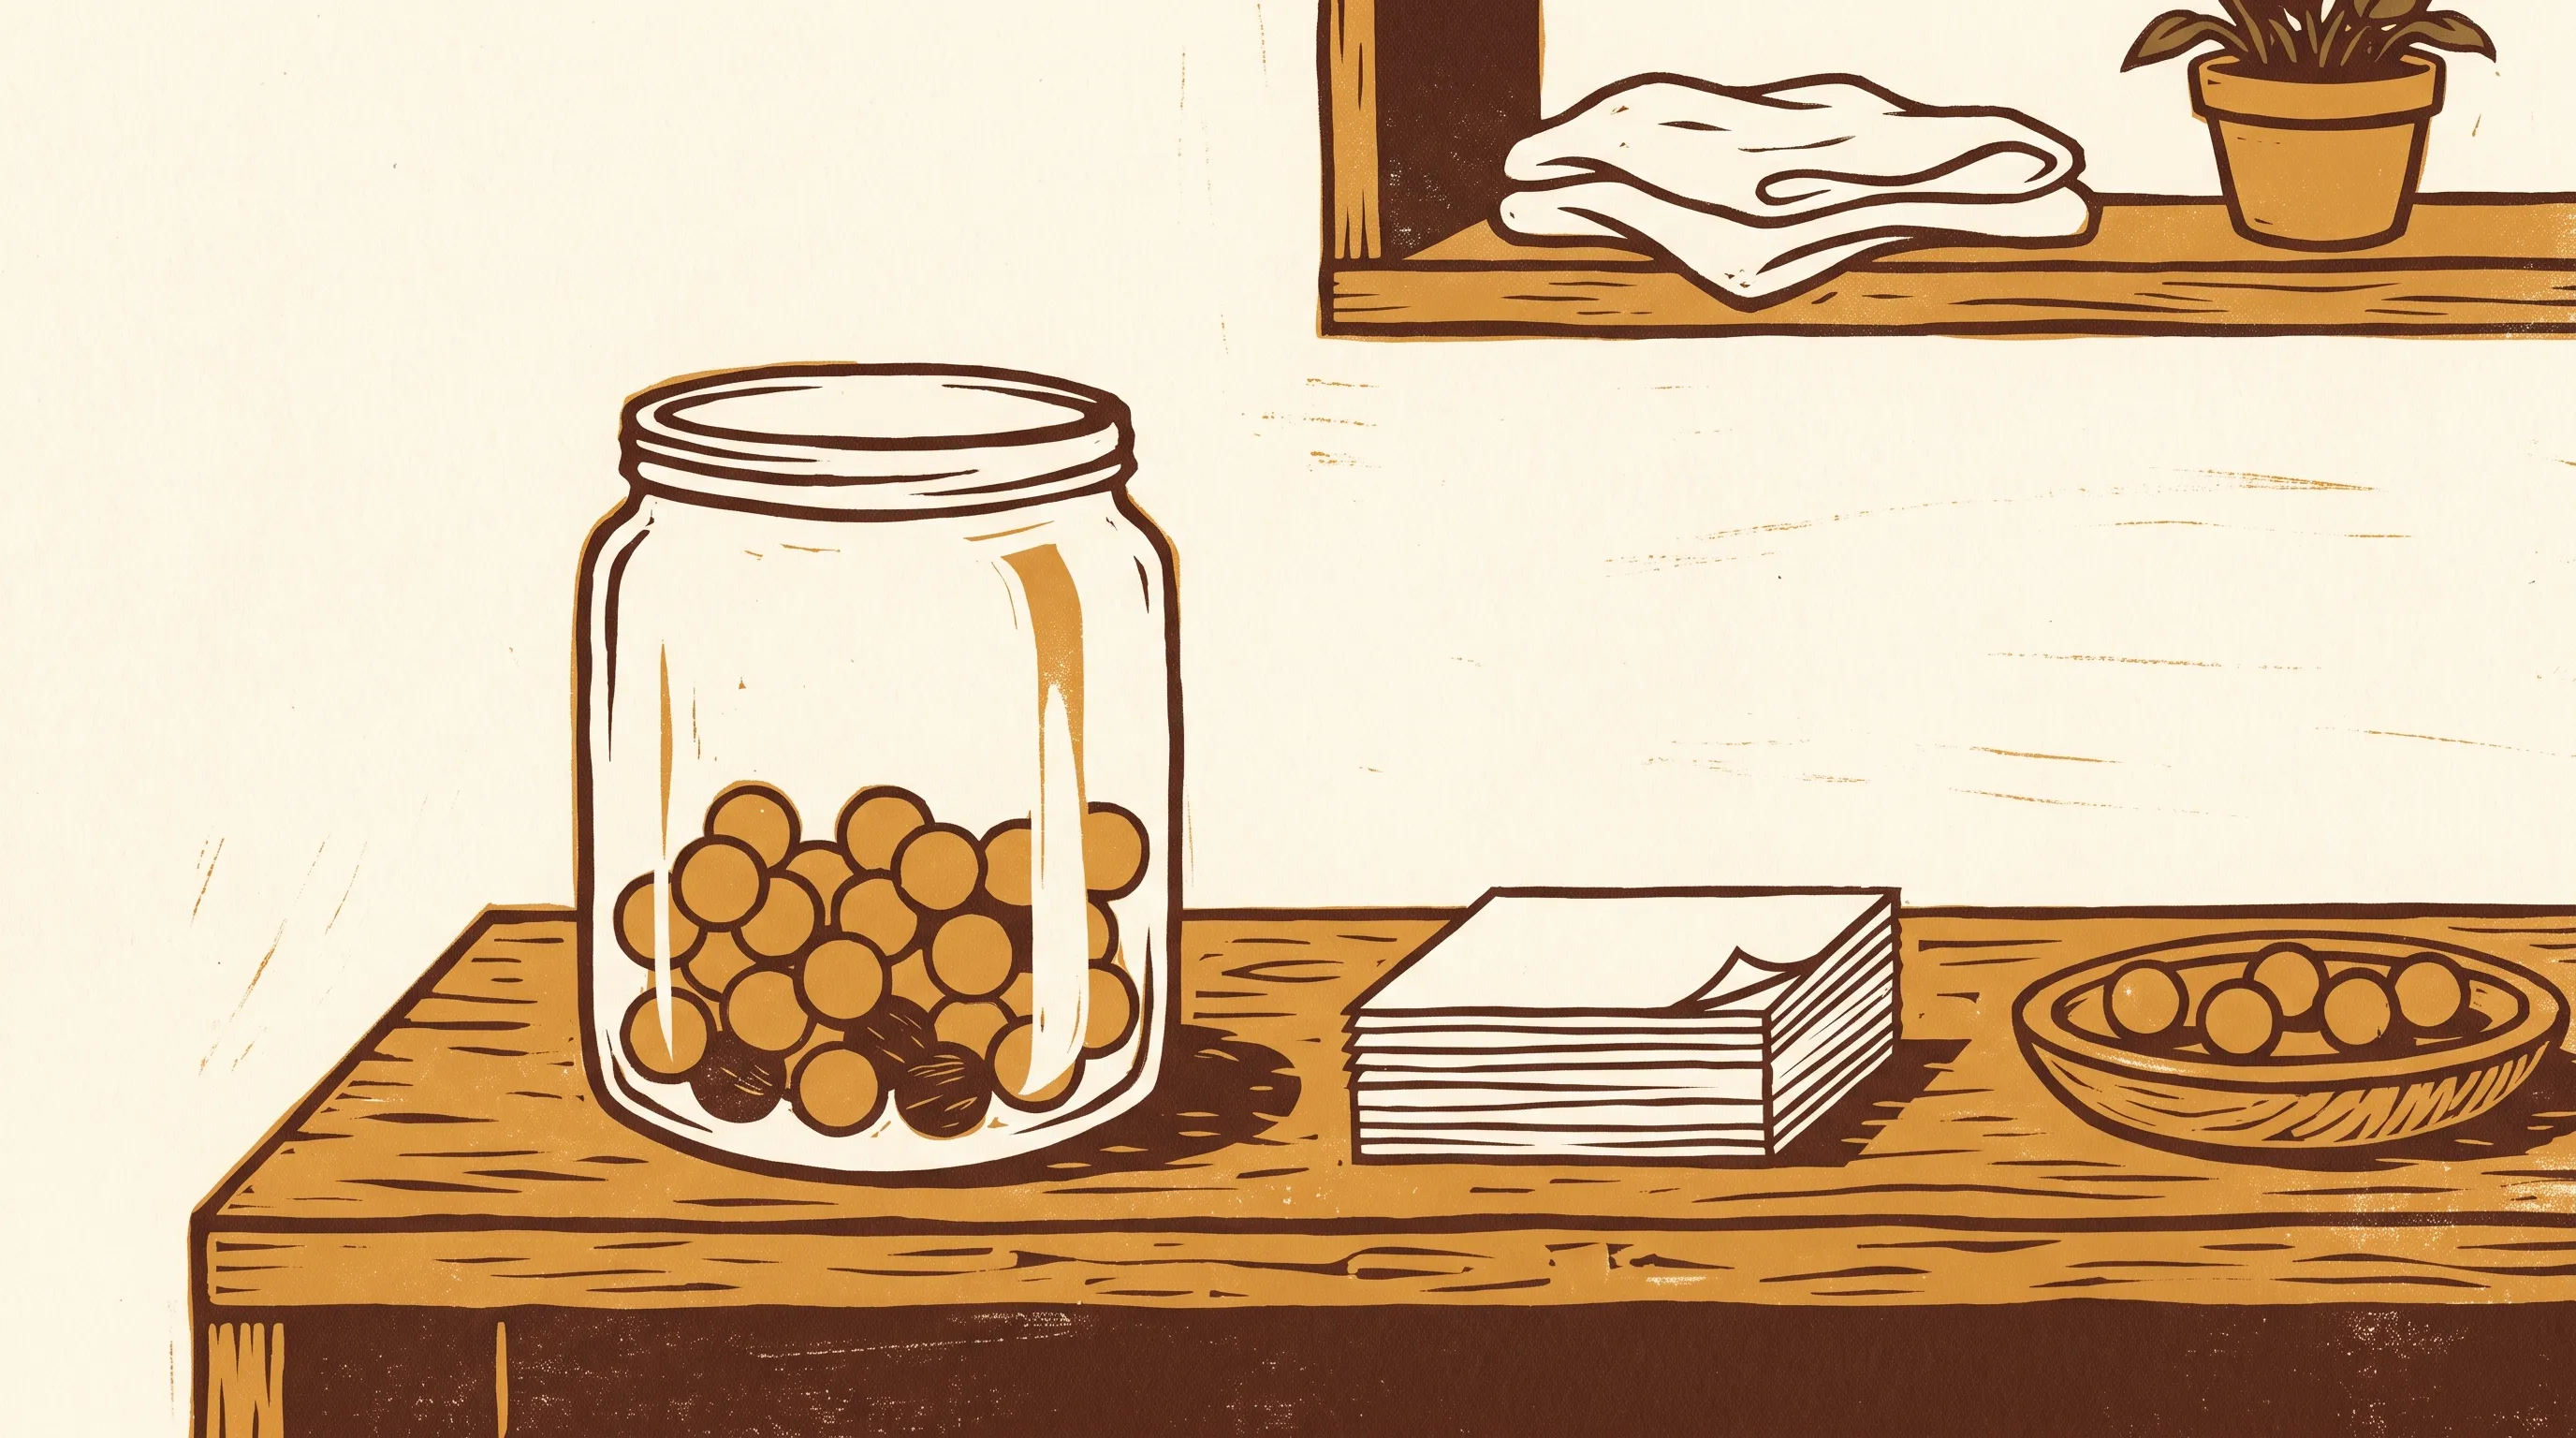
- The token or point economy. Students earn tokens, points, or stickers for specific behaviors, exchangeable later for a reward. The running-score version without a wall display is its own topic — see class points. It can run privately (a card on the student’s desk) or as a whole-class, interdependent system (marbles in a shared jar).
- The daily report card. A simple sheet that travels between school and home, rating a few specific behaviors each day, used mainly for communication with parents rather than in-class display.
The first format is the one that draws the most criticism. The other three, implemented well, have real support behind them.
Where Behavior Charts Genuinely Help
Behavior charts didn’t become a classroom staple by accident. As education writer Janelle Cox notes, they give students “a clear framework for students to understand what is and is not expected of them and the consequences of their actions,” and the real-time nature of the feedback lets a child “connect their actions with real-time consequences” instead of waiting for a report card weeks later (TeachHUB, 2024).
The token-economy format in particular has actual research behind it, not just teacher tradition. A 2022 meta-analysis in Behavior Modification reviewed 24 studies of token-economy systems in K-5 classrooms conducted between 2000 and 2019, spanning both general- and special-education settings, and found the intervention “yielded large effect sizes for both general and special education classroom types” (Kim et al., 2022). The review’s caveat matters as much as its headline: effectiveness tracked closely with implementation choices — which rewards backed the tokens, how often tokens were handed out, and how predictable the exchange schedule was. A token system built on vague or inconsistent rules doesn’t inherit the evidence built on well-run ones.
Where They Backfire — the Public Clip Chart Problem
The clip chart is the version most people picture when they hear “behavior chart,” and it’s also the version the field’s own research center has explicitly told teachers to retire. In a 2020 practice brief, the Center on PBIS — the OSEP-funded national technical assistance center behind the Positive Behavioral Interventions and Supports framework — laid out why: clip charts are “ineffective in changing behavior class-wide” for the students who most need support, “contribute to labeling and stigmatization,” and function as, in the brief’s own words, “a system for shaming students” (McIntosh, Sugai, & Simonsen, 2020).
The brief’s own diagnostic question is the sharpest part of the argument: “We can ask ourselves (or our students), ‘who is always on red?’ If we can easily list these students, then the chart is not effective in changing behavior.” A chart that reliably identifies the same handful of kids every week isn’t correcting their behavior — it’s just publicly re-labeling them. The brief also cites research on school discipline and race (Okonofua & Eberhardt, 2015, in Psychological Science) to note that when clipping falls disproportionately on students of color, students with disabilities, or students with trauma histories, the chart isn’t a neutral tool — it’s amplifying an existing inequity.
School psychologist Cheryl Blankman makes the mechanism explicit: “Public shaming is public shaming, no matter how colorful and bright you make it. Managing behaviors by way of a system that puts students on display with the looming shame of being called out publicly for missteps invariably creates an environment where psychological safety cannot develop” (Blankman, ASCD). Her point isn’t that clip charts fail to produce compliance — it’s that the compliance they produce comes at the cost of the trust a classroom needs for anything harder than obedience.
The ADHD (and Trauma-History) Blind Spot
Public charts don’t fail every student the same way. For students with ADHD, a whole-class chart penalizes exactly the regulation differences the condition produces. As Understood.org, the ADHD- and learning-difference-focused nonprofit, explains: these students “often need to move, talk, or get sensory input” to stay regulated — behavior a standard chart treats as a violation rather than a need. Over time, “students with ADHD may stop trying because the chart focuses on what they can’t do. It doesn’t focus on the skills they’re building” (Understood.org).
The same logic plausibly extends to students with trauma histories or sensory-processing differences, whose regulation needs are also furthest from whatever single standard the chart is measuring everyone against. A tool built around one visible standard for an entire room will, by construction, work worst for the students least able to meet it on a given day — which is a design flaw, not evidence that tracking behavior is inherently the wrong idea.
A Behavior Chart Is Not One Thing
It’s worth being precise about what the evidence actually rules out. It rules out public, whole-class display of individual status as a behavior-change tool — that’s the part with a consistent record of backfiring across the sources above. It does not rule out structured feedback, token economies, or tracking behavior over time; the 2022 meta-analysis found real effect sizes for exactly that, when it’s private, positively framed, and consistently run. The uncomfortable middle ground is that a chart can be badly designed in ways that have nothing to do with public display too — vague criteria, inconsistent follow-through, or a format that only records what a student did wrong. Choosing “no chart” and choosing “the wrong chart” fail for different reasons, which is why the fix below is a design checklist, not a verdict.
How to Choose (or Redesign) a Behavior Chart That Works
Four questions separate a chart likely to help from one likely to backfire:
Is status visible to the whole class, or only to the student and their family? In practice, this is the single highest-leverage change. A first-grade teacher who replaces a wall-mounted clip chart with a small laminated card kept in each student’s desk folder — checked privately during independent work time, never announced — keeps the same daily-tracking structure while removing the audience that made it feel like punishment.
Does it track what to do, or only what not to do? A chart with categories like “hands and feet to self,” “voice level,” and “on-task” gives a student something to aim for. A chart that only moves down for infractions gives them nothing to aim for except staying still.
Is the reward or consequence predictable, or does it shift? The 2022 meta-analysis’s biggest implementation variable was exactly this — a token system where the exchange rate and rewards menu are fixed and known in advance outperforms one where the rules change week to week.
Does the same handful of students show up in the same spot every time? If the answer is yes, the tool has become a label, not a lever, regardless of its design — and it’s time for a private conversation and an individualized plan instead of a group-wide one.
In practice, a workable version often looks like this: a daily half-sheet stapled inside each student’s folder, three specific behaviors listed by name, a sticker for each one met, checked privately during transition time, sent home each Friday. No poster, no public movement, no whole-class announcement — the structure a token economy needs, without the audience a clip chart creates.
Beyond the Chart: When Families Need to See More Than a Color
None of the four questions above require software — a laminated card and a marker cover most of it. But once a school wants that private, individualized behavior record to actually reach a family reliably — not live on a card that gets lost in a backpack, or wait for a Friday folder that doesn’t always make it home — the requirement shifts from a classroom design problem to a communication one: a private, per-child behavior record that the right parent can see and nobody else can.
That’s a narrower, more specific need than most general messaging apps are built for, and it’s one purpose-built school platforms are starting to handle directly. BeeNet is one option: instructors can log typed behavior notes and track behavior points per student, visible to that student’s own parents alongside grades — a private record rather than a public display, so a family sees the pattern without the rest of the class ever seeing a color. It’s one implementation path among several, not the only one, and it’s worth evaluating alongside whatever a school is already using for grades and attendance rather than as a standalone purchase.
Whatever a school lands on, the test doesn’t change: would this chart survive being read over the child’s shoulder, in front of their classmates? If the honest answer is no, that’s not a reason to abandon tracking behavior — it’s a reason to change who gets to see it.
References
- McIntosh, K., Sugai, G., & Simonsen, B. (February 2020). Ditch the Clip! Why Clip Charts Are Not a PBIS Practice and What to Do Instead. Center on PBIS, University of Oregon. https://www.pbis.org/resource/ditch-the-clip-why-clip-charts-are-not-a-pbis-practice-and-what-to-do-instead
- Kim, J. Y., Fienup, D. M., Oh, A. E., & Wang, Y. (2022). Systematic Review and Meta-Analysis of Token Economy Practices in K-5 Educational Settings, 2000 to 2019. Behavior Modification. https://journals.sagepub.com/doi/abs/10.1177/01454455211058077
- Cox, J. (August 2024). Are Student Behavior Charts Beneficial? TeachHUB. https://www.teachhub.com/classroom-management/2024/08/are-student-behavior-charts-beneficial/
- Blankman, C. Your Clip Chart Is Ruining Your Classroom Culture. ASCD. https://www.ascd.org/blogs/your-clip-chart-is-ruining-your-classroom-culture
- Garcia, K. (reviewed by A. Kahn, PsyD). Why classroom behavior charts might not work for students with ADHD (and what to do instead). Understood.org. https://www.understood.org/en/articles/classroom-behavior-management-system-adhd
- Okonofua, J. A., & Eberhardt, J. L. (2015). Two strikes: Race and the disciplining of young students. Psychological Science, 26, 617-624.

Ready to Transform Your School Communication?
Start saving time and increasing parent engagement with BeeNet.
Request Demo